Projects
Machine Learning Model
Tools: Python
Developed a machine learning model to classify traffic signs using the German Traffic Sign Recognition Benchmark (GTSRB) dataset. The dataset contained over 50,000 images and more than 40 traffic sign classes. The project involved image preprocessing, model training using a neural network, and achieving multi-class classification to accurately recognize and categorize traffic signs.

Data Analysis
Tools: R
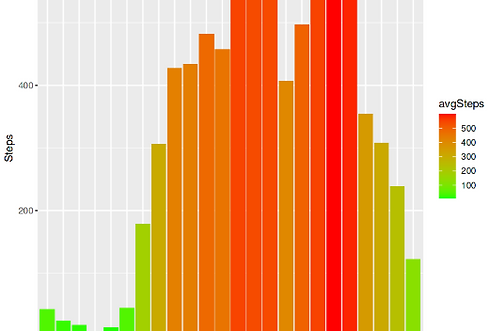
The project revolves around the analysis of Fitbit data to provide valuable insights on user activity, sleep patterns, calorie burn, intensity levels, and weight management. The goal is to utilize this data to generate recommendations that can enhance Bellabeat’s marketing strategy and user engagement through data-driven decisions.
Data Visualisation (Dynamic Dashboard)
Tools: Tableau
This interactive dashboard showcases customer reviews for British Airways, covering metrics like overall ratings, value for money, ground service, and more. Users can explore trends over time, compare ratings by aircraft, and analyze geographic variations. Filters for traveler type, seat class, aircraft, and date range allow for personalized insights into customer satisfaction and areas for improvement.

Data Visualisation (Dynamic Dashboard)
Tools: Tableau
This interactive dashboard provides a comprehensive analysis of customer revenue, highlighting key metrics such as revenue trends by month, state, age group, region, and product category. Users can explore geographic revenue distribution, analyze age-based spending patterns, and examine the correlation between discounts and quantity ordered. Filters enable customized insights, helping businesses identify key revenue drivers and optimize strategies.

Data Analysis
Tools: Python
This project analyzes stock market data for the top 10 companies, featuring exploratory data analysis, correlation analysis, and sentiment analysis. It identifies top performers based on stock price growth and trading volumes, assesses price volatility, and calculates moving averages to inform investment strategies.

Data Visualisation
Tools: D3.js
This project visualizes the expenditures on player transfers by five major Premier League clubs—Arsenal, Chelsea, Liverpool, Manchester City, and Manchester United—over the period from 2013 to 2023. The first graph shows the clubs' spending across the years, while the second graph highlights their league standings during the same period. The purpose of this project was to help users explore whether higher spending correlates with better league performance.

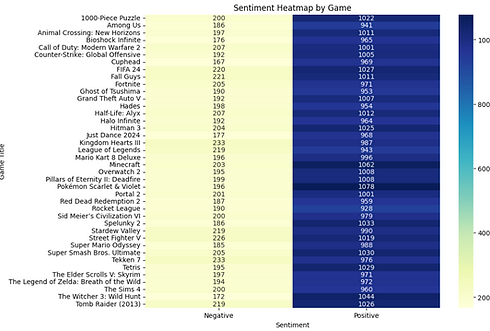
Data Analysis
Tools: Python
This project analyzes video game industry data, featuring sentiment analysis of user reviews, rating patterns across different genres and platforms, and price analysis. It examines game performance metrics using composite scoring (combining user ratings and sentiment scores), identifies top-rated games like The Witcher 3, and explores relationships between game length, pricing, and genre popularity across different age groups and platforms.